The Difference between .xls vs .xlsx – Microsoft Excel

Microsoft Excel utilizes the XLS vs. XLSX formats to store financial or mathematical data. Most businesses and other professional establishments use spreadsheets when presenting a report to visualize data through charts and tables.

However, for casual users, the one-letter difference between XLS and XLSX may initially be confusing. Thus, this article discusses a more in-depth discussion about XLS vs. XLSX and their other functions.

What Is XLS?

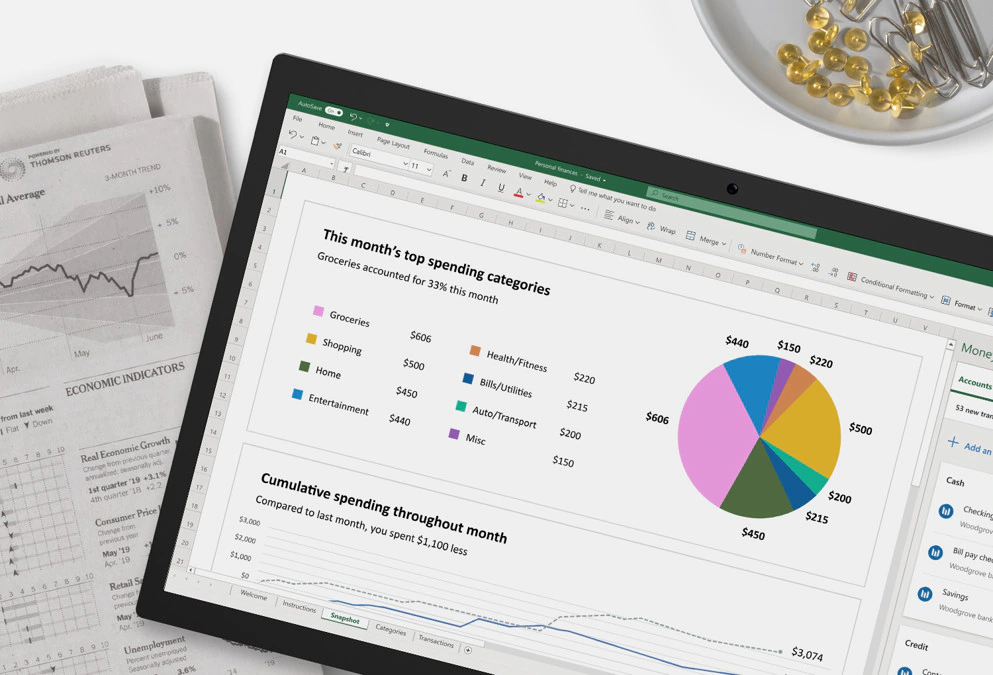
XLS files are commonly used to organize, analyze, manipulate, or visualize data, especially in establishments such as schools, and businesses, or even for personal use at home like to-do lists, expense tracking or even shortlisting schools for kids. Upon opening the Excel spreadsheet, a blank worksheet is shown, and a spreadsheet consists of a table with numerous columns and expansive rows and cells that contain data that may be entered manually.

XLS files may also be referred to as an Excel spreadsheet. This is because XLS is known to be an old version of Excel’s file extension that has a format that utilizes proprietary binary. This kind of formatting is used to store documents in Microsoft Excel, which is more formally known as BIFF or Binary Interchange FileFormat.

The XLS formatting was first introduced in 1987, the same time Microsoft Excel was released. With this, using XLS files to save spreadsheets became one of the popular methods when using Microsoft Excel, not until the updated version of Excel was released in 2007. XLS files were replaced by the XLSX format, which is more formally known as the Microsoft Excel Open XML Spreadsheet, and became the current standard for saving Excel spreadsheets.

What Is XLSX?

With its update, Microsoft Office 2007 added the letter “x” to many of its file extensions. These include “docx” for Word files and “ppt” for PowerPoint files. Its Excel files also upgraded and became “xlsx” from “xls.” This update includes a folder hierarchy in which small files are included in a very detailed manner. This type of formatting can also be compressed into a .zip folder.

Also known as open XML, XLSX is the updated version of Microsoft Excel’s file extension for their spreadsheets. XLSX is known to be more diverse since it is also compatible with software outside Windows, such as MacOS, Android devices, and iOS devices. It also includes visual basic for applications such as tables for pivots and tools for graphing.

XLSX also contains Excel operations beyond the plain data provided by XLS only. These include more advanced formulas, charts, and formats. Although it is not created for more advanced manipulation outside of Microsoft Excel, it can still retrieve plain data from other applications and read from it.

Similarities Between the Two

● Functionality

In terms of functionality, XLS and XLSX in Microsoft Excel can both be used for financial applications such as saving data for financial reports and utilizing mathematics models. This characteristic makes both files ideal for mathematical calculations. They also both contain linking features, which make it easier to hyperlink a file on an Excel cell.

● Graphics

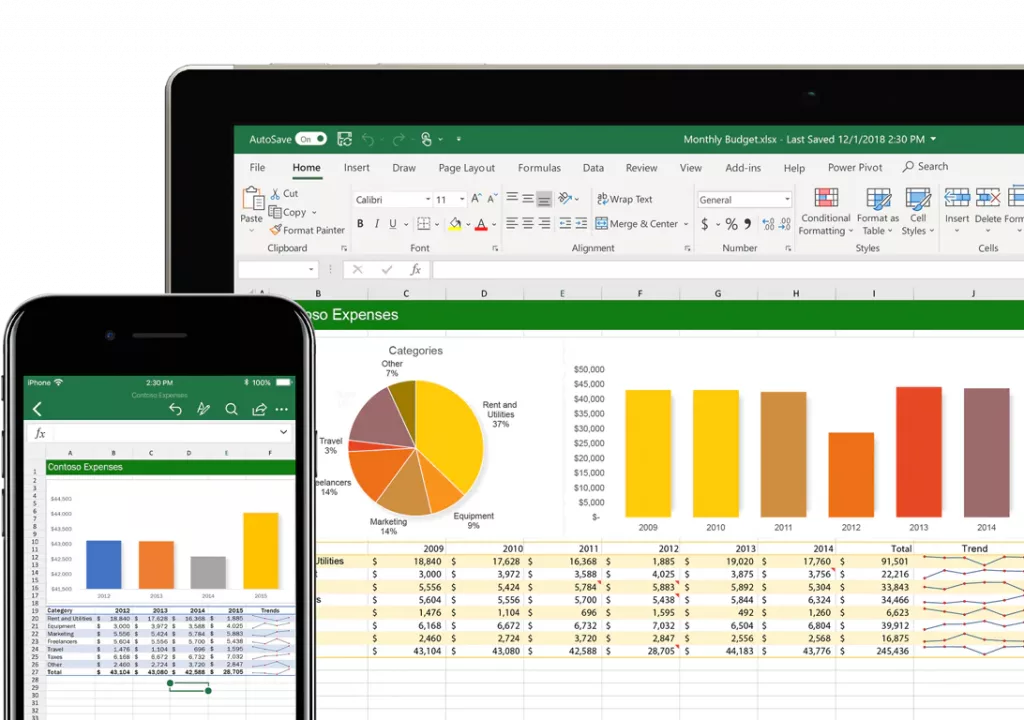
XLS and XLSX files both contain multiple worksheets upon opening the Excel application. Both files also include graphical and visual representations such as tables and graphics to present data. Filter data was also used to display data in a convenient and organized manner. Though presenting directly from Microsoft Excel may be inconvenient, presenting charts through this application and then putting it on a PowerPoint presentation is a great way of running and presenting reports.

● Versatility

Although they cannot be used for storing and modifying big chunks of data, since both programs are easy to use, these two types of Excel files can be mostly found in business establishments and professional contexts such as in universities, corporations, small enterprises, or even for personal home use.

XLS vs XLSX – What Makes One Better than the Other?

Due to its numerous updates and improvements in technology, XLSX is considered to be the standard when it comes to saving Excel files.

The significant thing about the XLSX file format is that it saves time in recovering or retrieving lost data since its updated Office application can easily detect defects that may happen while working on the file or document. Other factors include:

● Format

The main comparison between these two files is that XLS uses the standard binary format, while XLSX applies the updated version that is based on the format of XML. In addition, the size of XLSX files can be compressed and reduced when changed to XLS files.

● Speed

With regards to speed, regardless of its updated version, XLSX is known to be slower than XLS files, especially those that need a formula that is complex for bigger sets of numbers or data.

● Storage

In terms of storage, XML files utilize .zip compression techniques to improve the data storage of the device. Hence, with its newer updates, XLSX is designed to have a file size that is smaller than XLS files.

● Compatibility

Although XLSX is compatible with more devices than XLS files, the latter is considered more readable across all versions of Microsoft Excel. XLSX can only be read in 2007 and higher versions. Moreover, more spreadsheets are available in XLS files regardless if they include or support Macros. On the other hand, XLSX files are not.

● Design

Due to its design to prevent data loss from damaged files, an XLSX file is more robust than an XLS file and its binary format.

● Security

Due to its versatility, the XLSX format provides more security and transparency in its files. This means that it is easier to remove sensitive information such as personal data and other business-related information. This allows IT specialists to identify files with embedded codes using their unique format.

XLSX files can also update to improve their security from documents that have code embedded in them or even in macros files. This is because newer versions of Microsoft Office (starting from 2007) do not include embedded codes in their file formats.

When was Microsoft Excel Established?

Microsoft Excel was first released in 1985 and has since evolved into a powerful spreadsheet program, widely utilized by millions globally. As an integral tool for various tasks, including spreadsheet creation, budget management, and data analysis, Excel remains a staple for students, professionals, and businesses alike. However, with the advent of advanced technologies such as AI in accounting, there is a growing emphasis on streamlining financial management through automation.

While Microsoft Excel has been a cornerstone for organizing data and managing budgets, the integration of AI in accounting takes financial efficiency to a new level. Automation, driven by artificial intelligence, offers businesses the opportunity to optimize their financial processes, reduce manual workload, and enhance accuracy in financial reporting.

For students, understanding the intersection of traditional tools like Excel and modern innovations such as AI in accounting is crucial. It not only equips them with foundational skills but also introduces them to the evolving landscape of financial management. By incorporating automation into their learning, students can grasp the potential of AI in streamlining tasks, freeing up time for more complex analyses, and gaining valuable insights from data patterns.

In today’s fast-paced world, where businesses are constantly seeking ways to enhance productivity and accuracy, the synergy between established tools like Microsoft Excel and cutting-edge technologies like AI in accounting becomes paramount. Embracing this integration allows professionals to leverage the strengths of both, creating a more efficient and effective approach to financial management.

As Microsoft Excel continues to adapt and improve with each version release, its compatibility with emerging technologies ensures its relevance in an era where automation is reshaping industries. The combination of a versatile spreadsheet program and the transformative power of AI in accounting marks a new era in financial management, one where efficiency and precision go hand in hand.

Why is Excel Important for Kids?

Excel is an important tool for kids to learn because it can help them become more organized and efficient in their studies. It helps them develop skills that are critical for success in the professional world such as working with large amounts of data, creating useful reports and charts, and analyzing complex problems. Excel also provides students with a powerful platform to explore

  • Creative solutions to problems
  • Develop analytical skills
  • Become better problem solvers

Moreover, Excel is an effective tool for visualizing data which can help kids understand concepts more quickly and easily. With Excel, students can develop their critical thinking skills as they learn how to analyze data in meaningful ways. It also helps them learn how to make informed decisions by understanding the various relationships between variables and their impact on outcomes.

Excel is also a great way for kids to stay organized with their studies. It allows them to easily keep track of assignments, grades, and deadlines in an efficient manner. Additionally, Excel can be used to:

  1. create budgets,
  2. track expenses, and
  3. analyze trends

These are all valuable skills for kids to have. With Excel, students can also create charts and graphs which are visually appealing and help them better understand their data.

Frequently Asked Questions About The difference between .xls vs. .xlsx – Microsoft Excel.

Q: What is the binary interchange file format?

A: The binary interchange file format (BIFF) is the Microsoft Excel file format used to store worksheets in a binary form.

Q: What is the difference between .xls and .xlsx?

A: The main differences are that .xls files are saved in the BIFF 8 format, while .xlsx files are saved in the Office Open XML format.

Q: How is a spreadsheet file format developed?

A: The spreadsheet file format developed over time due to Microsoft’s efforts to make it easier for users to access and manipulate data from different sources.

Conclusion

In conclusion, both XLS and XLSX can systematically store mathematical and financial data. They also contain visual characteristics, such as spreadsheets with columns and rows that comprise a grid.

The main difference is that XLSX and its Office Open XML format is the newer version of XLS since the latter still uses the old proprietary binary format. In addition, since XLSX is newer, its format cannot be read by old versions of Microsoft, such as Excel 2003 and other earlier versions. However, because of its security and technological upgrade, XLSX is known to be better than XLS since it is easier to detect malfunctions when working on a document.

Microsoft Excel versions are constantly being updated with new features and formats, so it is important to use the most current version, from a default file format to a more secure one. To ensure the most up-to-date and secure documents, XLSX is your best bet.

References

H. (2022a, April 2). 7 Differences Between XLS and XLSX & 3 Ways to Convert Between. MiniTool.
https://www.minitool.com/news/xls-vs-xlsx.html

Stantor, A. (2021, May 22). XLS vs. XLSX: What is the difference between XLS and XLSX? Difference 101.
https://www.difference101.com/xls-vs-xlsx-what-is-the-difference-between-xls-and-xlsx/

V. (2022b, February 16). 7 Difference Between XLS And XLSX. Viva Differences.
https://vivadifferences.com/understanding-xls-vs-xlsx/

Power BI vs Excel – Discover the Pros and Cons of these great platforms

Overwhelmed with all the reports you need to prepare? Do you need a better way to manage all the data you have? Good news! Microsoft has two great options for you – Power BI vs Excel

We all know that data is power. It is essential in every aspect of business—whether for accounting, finance, marketing, operations, and research. But what’s the best tool to visualize the data you have and get the insights you need? Let’s drill down the features of each product.

Looking to Upgrade your Data Analysis Tools?

With so many platforms available, choosing the right one for your business needs can be overwhelming. But before you take the plunge and commit to a platform, it’s important to understand how each option stacks up against the other and which system best suits your individual needs. That’s why we’ve broken down Power BI vs. Excel – two of today’s most popular analytics applications – into their pros and cons.

Desire: By comparing these two powerful systems side-by-side, you can decide which is best for your business or project. Whether it’s creating stunning visuals or advanced calculations, both solutions have their strengths–but they also come with their weaknesses. Let us help you determine if Power BI or Excel would be the optimal choice for your situation.

What Is Power BI?

Are you having difficulty gathering and understanding data from different sources?

Let’s face it, as a business owner, it’s a tedious task to analyze data from different sources. Have you ever wished to have it all in one place and get insights at a glance? If so, what you need is a software solution that has AI capabilities and sophisticated data analytics and visualization tools—that is what Power Bi is all about.

Power BI stands for Business Intelligence. It is ideal for consolidating, managing, and visualizing big data from different sources into one platform. It makes gathering insights fast and easy, regardless of the amount of data one has to digest.

With Power BI, you can discover relevant information, and get and share insights with the team as it can connect to Excel spreadsheets, cloud, all sorts of databases, and flat files. It is not only for business owners and enterprises, but for professionals who work heavily with data such as research, national government, and the like.

Features

  • Advanced AI capabilities – Extract important information by recognizing an image, analyzing text, and identifying the key drivers while seamlessly integrating it with Azure Machine Learning.
  • Data visualizations – Regardless of how complex it is, Power BI visualizes your data into infographics or interactive presentations that would suit your audience.
  • Dashboarding – Simplify all the data insights you got and have it all at one glance for easier monitoring.
  • Reporting – Keep everyone aligned by sharing reports with the team. With Power BI, you can generate a single sheet or multiple-page report with adjustable filters that allow users to see specific data.
  • Accessibility– Anyone who has been granted access can view, manage, and edit the data even on their mobile phones.
  • Intuitive interface– Everything is intuitive and easy to navigate.
  • Third-party data integration– You can connect it to different apps and platforms to import and export data.
  • Uncompromising security – Apart from end-to-end encryption, it is built on Azure’s system and uses the same security control as used by organizations with the world’s most sensitive data.
  • Real-time access monitoring– It lets you and the team stream, make changes, and update the information in real time.

These are all important factors when you are comparing power bi vs Excel.

Pros and Cons of Power BI

ProsCons
AffordabilityTable Relationships
Custom and Interactive VisualizationsConfiguration of Visuals
Excel IntegrationCrowded User Interface
Data ConnectivityRigid Formulas
Prompt UpdatesHandling Large Data Volumes
Power BI EmbeddedComplex to Understand and Master
Data Accessibility
What are the Pros and Cons of Power BI

What Is Excel?

Excel is another great tool to input, and sort numbers, and data with formulas.  It is widely used by students, professionals, and entrepreneurs for basic data analysis. Organizations use it for all business functions, but most especially for financial analysis. However, there is a limit to what Excel can handle, as it can only store and analyze a certain amount of data.

Some people get confused when in Microsoft Excel when it comes to the different formats available in Excel, so we have made this easier for you – Check out our article on the difference between Microsoft xls vs xlsx.

Features:

  • Graphical presentations of data into the chart and picture format – you can present the data in charts, free-form shapes, smart and clip arts.
    • Chart options – column, line, area, scatter, data series, axes, chart sheet, trendline, combination chart, Gantt, Pareto, and gauge. 
  • DataBase to input, store, sort, and manage up to 1 million records – summarize and sort information with pivot tables, slicers, sparklines, sort, filter, data validations, and grouping.
  • Functional tools to formulate and calculate data – it has over 300 built-in formulas to calculate information and automate repetitive tasks.
  • Sort by order, color, list, and function
    • Filter by number, date, text, data, and values
    • Conditional Formatting by rules, bars, color scales, icons, and heat map
    •  Pivot Tables options – group, multi-level, frequency distribution, slicers, calculated field, and pivot data
  • Analysis tools to get insights from data – What-if analysis, histogram, statistics, ANOVA, f-test, moving average, t-test, z-test, regression, correlation, and tables for quick analysis.

Did you know any of these differences between power bi vs Excel?

Pros and Cons of Microsoft Excel

ProsCons
AffordabilityLearning Curve
Data OrganizationCalculation Errors
Third-Party SupportTime Consuming
Office IntegrationSystem Compatibility
Statistical Analysis
What are the Pros and Cons of Microsoft Excel

Similarities between the two platforms

  • Both are used in data sorting and visualization
  • Both can create dashboards
  • Both use pivot
  • Both can add integrations

Difference between Excel and PowerBI

 ProsCons
ExcelIdeal for tabular financial reports and forecasts  
Allows duplicate tables     
Mostly used for deep driver analysis  
Limited data handling  
Doesn’t allow cross-filtering between charts  
For surface-level analytics  
Can slow down when processing a large data set  
Not mobile-optimized  
Power BIIdeal for big data analysis and visualizations through KPIs and dashboards.  
Allows advanced cross-filtering between charts  
For high-level analytics  
Flexible data sharing  
Uncompromising data security  
Can build up customized reports  
Speed processing even for the larger data set  
Mobile-optimized and suitable for any device  
Can’t show duplicate tables  
Premium access is expensive

The pricing difference between Excel and Power BI

The minimum cost for Power BI is $9.99 per month while Excel is $1.99 only.  Power BI is expensive compared to Excel, but it is considered cost-efficient with all the benefits that it can provide. It allows you and the people in your organization to have an automated and efficient workflow while having data-driven decisions.  There are also other premium features that you can integrate as you upgrade your subscription.

 PriceBenefits
  Power BI Pro  $9.99 Per-user/month    Self-service analytics Data visualizations with dashboards and reports Data and insights sharing to multiple channels/teams  
Power BI Premium – per user$20 Per-user/month 2  Includes the core functions of Power BI Pro AI capabilities for advanced insights generation Big data preparation Easy data management Enterprise-level access    
Power BI Premium – per capacityStarts from $4,995 Per capacity/month    Includes all the functionality in Power BI Premium   Enables content publishing   Autoscale is allowed with an Azure subscription    

If you are unsure yet if Power BI is the right software for your business needs, you may get started with a free trial. Simply download the Power BI desktop application and start generating reports and visualizations for free. You can even work on the go with the Power BI Mobile app. Both applications are free.

As for Excel, it is already part of Microsoft Office 365 subscriptions. Almost everyone already has it installed in their operating system, but there’s also a free version of it for Mac users. There’s also a free web-based version of Excel accessible through one drive.

It’s hard to say that one tool is better than the other as both have advantages and disadvantages. It would depend on what the user needs. To sum it up, Excel is mainly for organizing data with numbers and formulas, whereas Power Bi is for enterprises handling a large amount of data.

Advantages of Power BI over Excel

Power Bi is for extensive data analysis that requires AI capabilities and is designed for deep data gathering and insights. If the goal is to have the data in a spreadsheet and calculate the mathematical and statistical formula, then Excel is the tool to use.

You may start with Excel and move to Power BI as needed because Excel can also be integrated into Power BI. But for a data-driven organization that requires high-level data visualization, reporting, and collaboration, better to invest in Power BI right away.

Things to Consider in Choosing the Best Data Analysis Tool

When choosing a data analysis tool that is right for your business needs, there are certain things you need to consider. These include:

1. Data Sources: Different data analysis tools have varying capabilities to integrate with different data sources. Depending on the data sources you need to work with, you should choose a tool that can handle them seamlessly.

2. User Interface: The user interface is an important consideration when choosing a data analytics tool, especially for non-technical users. Some tools have a more user-friendly interface than others.

3. Data Volume: Analyzing data or data analysis expressions requires a tool with high processing power. If you need to work with large datasets, choose a tool optimized for big data.

4. Data Integration: Choosing a tool that integrates with your existing software ecosystem is important. This ensures you can work with data from different sources in a single platform.

5. Customization: Different businesses have different needs for data analysis. Choosing a tool that can be customized to your specific business requirements is important. From data transformation capabilities to custom visualizations, you should select a tool that allows you to customize it for your unique needs.

6. Collaboration: If you need to collaborate with other team members on data analysis, choose a tool with collaboration capabilities.

Both tools have strengths and weaknesses when choosing between Power BI and Excel. Excel is a reliable data analysis tool that has been around for decades and is well-known for its power pivot tables, formulas, and graphs. Power BI service, on the other hand, is a more modern tool that specializes in data visualization tool and business intelligence. While both tools can handle large data sets, Power BI has an edge regarding real-time data analysis and cross-platform accessibility. However, Excel has more extensive formulas and data manipulation capabilities, making it more suitable for complex calculations.

Frequently Asked Questions About Power BI vs. Excel – Discover the Pros and Cons of these great platforms

Q: How can a data model be used in Power BI?

A: A data model is a logical structure that organizes and stores data. A user can create and manage data models in Power BI to analyze large datasets quickly and easily.

Q: Can mobile devices be used to access and work with Power BI and Excel?

A: Yes, both Power BI and Excel offer mobile applications that allow you to access and work with your data on the go.

Q: What business analytics tool is more suitable for small businesses and start-ups: Power BI or Excel?

A: Excel will likely be the more cost-effective option from a budget perspective. Most businesses already have access to Excel with an Office 365 subscription, making it a familiar choice.

Q: Why Choose Data Power BI and Power Query for Data Analysis?

A: Data Power BI and Power Query are cutting-edge options with unique capabilities that cater to the ever-changing demands of modern data analytics

Conclusion

After examining the benefits and drawbacks of Power BI vs. Excel, it is clear that both are incredibly powerful platforms for data manipulation and analysis. Whether you choose Power BI or Excel to further your business insights depends on your needs. If your goal is to create interactive visuals and work with large datasets, geospatial analytics, and AI Insights, then Power BI is a great option. On the other hand, if your organization already has Excel experience – there’s no need to reinvent the wheel – use what works best for you.

Furthermore, integrating these two platforms can open many possibilities for others in your industry. Ultimately, learning how to make the most of these applications will increase productivity and allow anyone to become an expert in their chosen data processing platform.

ANALYZE – Analytics Platforms

Introduction

Data is easy to analyze when you only have so much. But it’s a heavy load when you have data as numerous as the stars.

In business and any large organization, the population of data is massive. The solution is effective data analytics and a system that can handle the load. The more information comes to your doorstep, the more processing it needs.

Today, business analytics have come a long way with the introduction of artificial intelligence, cloud, automation, and integration. Your favorite platform will not just solve a single problem in one area, but it could streamline the entire process of your business.

Continue reading as we present the finest analytics platforms and how they can take your business to the next level.

What are Analytics Platforms?

The driving force for business operations and strategic decisions are historical data. For data-driven companies, handling large volumes of data is an ongoing challenge.

Once you have organized the data, how will you interpret it? And will you analyze data relationships most productively? You can make your life easy if you use analytics platforms.

An analytics platform is a business solution that uses digital technologies to address the needs of the whole enterprise, particularly in data storage, management, and analytics.

Benefits of Using Analytics Platforms

1. It helps you make data-driven decisions.

It would be best to have a solid basis and not a whim when making your next move. Analytics platforms assist you in data organization and analysis so you can gain valuable insights for smarter decision-making.

2. It makes you productive.

Analytics platforms carry tools that proficiently manipulate your data so that no time is wasted. With mind-blowing automation features, you can further define a set of actions once the trigger is activated.

Data collection and management might be simple, but these mundane tasks take up much time in the long run. Analytics platforms help you accelerate these activities to see insights quickly.

3. It enables teamwork

Analytics platforms build room for collaboration. Because of the quicker formation of insights, your team will focus on contributing to the decision-making process.

4. It breeds an innovative mindset

Aside from unlocking insights punctually, it allows your team to innovate and create new business models. The great thing about analytics platforms is that it permeates every department in the business, creating more ideas and opportunities for improvement.

The Top Analysis Software

Excel

Microsoft Excel has been one of the most prevalent platforms used individually or as a business. But just like any tool, it depends on the user’s skill and creativity.

The software is famous for its conditional formatting tools, which automatically format cells if they meet specific criteria. A slight color change can trigger you to determine key results and make strategic decisions.

Do you have a wide, data-rich table and want to extract specific common data? With Excel, you can manipulate the data using Pivot Tables. You can sort data the way you want and place all of them in your design table. Use the generated tables to create charts or insert slicers for further data sorting.

Add to that Excel’s Paste Special, Flash Fill, and Filter options to manage data; it’s such incredible software.

Click here to see our full Excel review.

Power BI

Power BI is also a Microsoft masterpiece, specializing in viewing reports, analyzing trends, and monitoring specific data. It is a cloud-based collection of tools that intelligently manages data from various sources into a single consolidated data set.

You can choose from three types of Power BI platforms: Power BI Desktop, Power BI Service, and Power BI Mobile. You can deploy the software locally or through the cloud.

A remarkable feature of Power BI is its attractive visualization. The software gives life to your data by translating them into detailed and vivid dashboards. You can choose from simple to complex visualizations or make your own.

Power BI lets you grab data from various sources such as Excel, Power BI database, Power BI dataflows, SQL Server, MySQL database, PDF, Oracle, etc.

The platform converts the retrieved data into datasets you can filter further and break down into smaller subsets.

Click here to see our full Power BI review.

DOMO

Domo is a cloud-based software with business intelligence tools that collect, analyze, and convert data into great visuals. With over 1,000 pre-made cloud connectors, you can connect to your source data however you like.

Whether your data is on-premise or stored in a cloud doesn’t matter. In Domo, you can do both while ensuring the security of your data. Domo is also flexible enough to handle any file format, such as .csv, .pdf, and .mp4.

Do you have data that needs consolidation and comes from multiple sources? Don’t worry because Domo’s Magic ETL and DataFusions platforms got your back. You don’t need to do any coding. Build your data pipeline by dragging and dropping datasets, actions, and connections.

Integrate yourself, your team, and your system with Domo’s impeccable integration capabilities.

Click here to see our full DOMO review.

Airtable

If Microsoft Excel and other spreadsheet software are insufficient, try Airtable. Because of the software’s ability to promote easy collaboration, it is used worldwide by all businesses, big or small.

Because of SQL scripting, people tend to avoid databases. Airtable is different because it makes database management straightforward.

One of the most powerful features of Airtable is that it can create relationships between tables and link them. Airtable also gives you the benefit of placing images on your platform. Building a table is quick; if you already have data, you can upload them.

Compared to conventional worksheets, Airtable’s layout is fresh to the eyes and super intuitive. The program can also be integrated into other applications like Shipstation and Slack.

Airtable is commonly used for blogging, CRM, project management, and marketing. You might have to subscribe to its premium plan to enjoy its full functionalities.

Click here to see our full Airtable review.

Success Stories with Data Analytics Software

It’s hard to believe something that we haven’t seen yet. And so we bring to the table some evidence that proves companies using data analytics software reaped the benefits of using them.

Adobe

Adobe has continually renovated digital content creation and management for almost four decades. To sustain their efforts in seeking user engagement about their products, they partnered with Microsoft Azure and Microsoft Dynamics 365 in 2016.

The company used Adobe Analytics Cloud to gather data from different sources and define the data collected. By linking the platform with Power BI, their analysts could build interactive dashboards that work seamlessly with Azure.

Adobe Analytics can handle 100 trillion transactions with its customers in one year. But by infusing Power BI, analysts can use its service to extract deep data from multiple sources and pick content packs.

Hewlett Packard (HP)

Specializing in computer hardware and services, HP accommodates 48 million PCs annually, serving over a billion customers across 170 countries.

To strengthen their sales team, HP tasked ExcelHelp to find solutions to improve their team working on a client. Their problem was that they were only using catalogs when selling the servers. This situation prompted them to seek a multi-purpose Excel that can do the following:

· The spreadsheet must function as a database

· The database should be user-friendly and dynamic and produce stunning visuals

· Their sales team must be able to print a PDF that shows comparisons of two servers.

They found the key to their problems through Microsoft Excel. The software helped them to select server features and filter products that did not meet the client’s requirements. The created Excel application enhanced images and increased their sales for this product.

Furthermore, Excel gave them an interactive product to aid their sales team when deployed at customer sites.

National Geographic

It’s safe to say that National Geographic is one of the most reputed television shows and one of the most well-loved. With lots of disparate data from multiple sources, it was challenging for the company to analyze and visualize them for appropriate decision-making. Domo was the missing piece of their puzzle.

Using Domo’s integration prowess, they could check their ROI in real-time. Data transparency was no longer an issue of Domo’s ability to visualize and convert complex data into understandable graphics. The KPI visuals can then be sent across multiple platforms.

Domo also increased productivity by reducing two to three hours per day. They originally made a monthly digital website traffic analysis, which took them a few hours. With Domo, it only takes a few minutes.

Another remarkable achievement is Domo’s mobile accessibility. This allows NatGeo’s teams to collaborate and communicate regarding the data.

How to Choose an Analytics Platform

Incorporating analytics software into your business is an amazing experience. However, there are several key factors you need to consider.

1. Business Requirements

From the onset, you should already have a clear picture of your business organization, structure, and system, so you can define what you need. Use this as a baseline to know how far you want your business to go in a certain direction.

Make these core objectives your driving force to identify analytics that will be measured with your prospective platform. Do an in-depth study of each platform that will provide the necessary data sourcing, consolidation, analysis, and visualization. Choose the platform that hits that business objectives bullseye.

2. Resources

Before venturing externally, look closer at your in-house capabilities to see if they will suffice in building your dream analytics platform. Do you have the necessary skill set and network capacity to support this endeavor?

If the answer is no, then you might have to invest in an analytics tool, which should also be cost-effective. Most analytics platforms offer basic features of free plans, but to enjoy their full potential, you may have to subscribe to the premium plans. You need to know how the analytics platform company will implement monthly, annual, or other cost structures.

3. Integration Capability

With various platforms being used, using a platform that easily integrates with other programs is highly advantageous. If unforeseen events occur and you need to migrate to another program, it won’t be much hassle if the platform easily integrates with any program.

4. User-friendliness and Comprehensibility

The users of this platform will base their decisions on actionable insights, so the visualizations must be near perfect. The platform’s user interface can make or break your team’s analysis. The platform has various types of users that must be versatile enough to handle them.

5. Intelligence

Data is useless if not converted into meaningful information. The analytics software you have chosen should be able to detect patterns, trends, and possible outcomes. Almost any platform can do simple mathematical calculations, but advanced statistical projects are the real deal.

6. Mobile Accessibility

Gone are the days when you solely run applications and monitor websites on the computer. To keep you updated with the company anytime and anywhere.

It’s a piece of cake if you belong to a simple organization in one location. Still, it’s a different magnitude when you have a large organization located in different areas around the globe.

In implementing mobile accessibility, you need to answer the following questions:

  • Who are the users to be given access to mobile analytics?
  • How will you define the roles and authorities of each user? Can everyone view and edit also?
  • What are the specific analytics you want to be included in the mobile?

7. Scalability

Analytics software is usually designed to help your business start and grow gradually.

But what if your business needs to spur the growth of your organization? Is your chosen analytics platform ready to accommodate the changes?

You can still access real-time data and insights if your software is scalable.

8. Connectedness

Two is always greater than one. In the same way, synergy can be achieved when the analytics tool promotes collaboration and teamwork. When you allow connection among your team members, the brainstorming and problem-solving processes are easy peasy.

Your selected software must enable users to interact with data for sharing, analysis, and interaction. In this manner, even the decision-making is done collaboratively.

9. Customizability

Since your business is unique and different from other companies, choose an analytics tool that fulfills your needs. Your business likely requires a special set of visualizations that you can integrate into your company operations.

Aside from the present needs, it would be best if you also projected plans for the future. This gives you an idea of the level of customization you want to apply on your platform, like the dashboard and graphics.

10. Data Sourcing

Are you sourcing structured, semi-structured, unstructured data, or a combination of these? When retrieving only one data type, your software can already do it. It should be enough.

However, if the data is highly disparate, you need seasoned analytics software to combine these data.

11. Security

Your data is considered a company’s asset, so picking platforms with weak security is not smart. Evaluate the software’s security controls that will safeguard your information.

Because of mobile accessibility, users can access data outside, so it still carries a risk they are already beyond the company’s firewall.

The digital world is flooded with software to keep the digital ecosystem alive and working. However, All these platforms will not function independently if not managed. So the key to all of this is you.


Featured Platforms: Excel, Power Bi, DOMO, Airtable

Monday.com: Bringing App Integration and Automation Closer To Your Business

In search of a low code workflow automation platform to simplify your business operations? Continue reading to learn about Monday.com.

Technological innovations unceasingly transform the global economy. Trends have clearly shown that digital technology has become a major determinant of a company’s growth, competitiveness, and success.

Given these facts, any company and organization must adopt an effective system that improves communication, collaboration, lead management, and overall performance.

An award-winning app, Monday.com offers today’s best solutions to your project management, automation, and app integration. No longer are the days that you dread Mondays because, with Monday.com, work becomes painless.

Top-notch solutions for low code workflow automation, app integration, and project management

Monday.com is a cloud-based platform committed to helping a company grow by providing all the tools needed to run a business effectively and intelligently.

Currently, companies utilize several apps for communication, analytics, marketing, finance, lead management, and many more.

A recent survey reveals that an employee in every industry has to juggle 9-11 applications daily just to accomplish a task.

As a result, managers and their subordinates confront a set of unprecedented challenges like information overload, loss of leads, slow response, poor tracking, and repetitive work. Needless to say, these will hurt the business and productivity in real-time.

Monday.com addresses these problems by offering its clients a highly intuitive platform that can integrate multiple apps, automate workflows, and level up collaborations. It provides the team a space to keep track of their progress, document threads, and share leads and ideas.

Monday.com is equipped with an algorithm that allows customizations that match the nature and needs of the company or department.

What Monday.com can do for a company is indeed noteworthy. More than 100,000 teams including industry giants Unilever, Uber, and Adobe entrust their operations and productivity to Monday.com.  The good faith of their clients certainly precedes their reputation as one of the leading project management tools globally.

How does the platform work?

Among the platform’s many functionalities, app integration and automation are where they shine most.

They recently launched the Monday.com app marketplace that brought their app integration capabilities to a higher level. Monday.com is now fully integrated with leading apps in productivity like Microsoft Team and Adobe Creatives.

The app integration tool of the platform allows you to create a personal work hub, where all your work-related apps are gathered and connected. Their algorithm collects the data from each app and consolidates it in Monday.com. In this way, you can access, share, and process the information with less confusion and effort.

Monday.com can also transform the dynamics of business operations by introducing workflow automation. They offer built-in recipes to eliminate the need to perform manually company’s routine tasks.

The remarkable level of app integration and workflow automation that Monday.com offers is highly credited to the Application Programming Interface (API) based on the GraphQL structure. It guarantees seamless, reliable, and secured execution of these functions while accommodating customizations that better suit the unique nature of a company.

Apart from all these, the cloud-based work operating software was designed meticulously so that managers and members of the team can effectively monitor and analyze the progress of their respective projects.

How is Monday.com different from its competitors?

The market is full of project management apps like Monday.com, but some qualities make this platform one of the best in the industry.

First, no better software can top Monday.com in task management. The platform stirred away from the old and ragged approach in task management. Instead, it designed an amazing system that can assign tasks, agendas, deadlines, person-in-charge, concerns, groups, and other factors often included in data-driven decision-making.

The second advantage of Monday.com is the superior visual workspace. Not all platforms have visual presentations as comprehensive, organized, and clean as this one. You can map out your to-do lists, goals, and schedules on Monday.com. At the same time, the platform guarantees that your visual workspace is perfect for your preference.

Customization is another big gun for Monday.com. Any employee, with or without a programming background can do since the platform requires no coding or programming work. In addition, Monday.com has opened itself to customers, partners, and even third-party developers as they can now create apps on the platform. Such an option can expand and tailor-fit the purpose of Monday.com to their company.

Lastly, Monday.com values data security and privacy, placing strong and reliable safeguards to prevent data theft and snooping.

Monday.com is best for

… EVERYONE.

The reality is that, whether a business is small or big, its operations need a cloud-based system such as Monday.com to stay on top of everything.

This low code workflow automation platform is extremely versatile and flexible in that it can adapt to any line of work. It has been proven useful in simplifying the sales pipeline, boosting marketing campaigns, organizing project roadmaps, event planning, content creation, and so many more.

On top of all these, every department, be it HR, finance, marketing, sales, or R&D can use the software to improve overall operations and collaborations with other teams.

Team leaders and managers could have better monitoring and presentation of data as well as the progress of every project or goal of the team. Moreover, with a properly streamlined workflow, they could easily determine areas that need support or improvement.

The diverse applications of Monday.com are being exploited by many fields such as:

  • Engineering and Construction
  • IT
  • Content Creation
  • Marketing and Sales
  • Advertising

What are its existing integrations?

Monday.com can bring together a diverse set of apps you use in your work including, but not limited to the following:

  • Google Drive
  • Gmail
  • Google Calendar
  • Other Google Suites
  • Outlook
  • Microsoft Team
  • Slack
  • Zoom
  • Excel
  • Zapier
  • Adobe Creatives
  • Zendesk
  • Shopify
  • Survey Monkey
  • Mailchimp
  • Facebook Ad
  • Gitlab
  • Github
  • Asana
  • Trello

Final Say…

Any company that strives to succeed in its respective line of business must invest in cloud-based systems and project management software. Its impacts are outstanding although not immediate.

“Today’s high-performing applications enables every person to do more in less time.”

Using Monday.com can significantly reduce IT costs and meaningless labor. Scaling up and down becomes more of an option rather than a faraway solution. A company with a reliable system such as this can boost not only the company’s profits but the efficiency, productivity, and motivation of every employee.

Excel: The Electronic Spreadsheet For All Your Business Needs

Do you need an excellent electronic spreadsheet for your business?

Simplifying your day-to-day work processes  

You scramble through piles and piles of folders in your office drawer, looking for specific data you need for a report you are finalizing. 

You argue with your teammates about the analysis that you have supposedly corrected but never reach them. 

Or your audits accumulated and are all waiting for you on your desk as you return from a weeklong holiday. 

These are some of the most common problems (and a lot more) that can easily be resolved and simplified by integrating Microsoft Excel into your daily business operations. 

What is Microsoft Excel?  

Microsoft Excel is an electronic spreadsheet that is part of the Microsoft Office Suite software, developed by Microsoft initially for Windows and Mac OS, now also for iOs and Android. Some of its functions are: 

  • Data record and supervision 
  • Calculation and monetary analysis  
  • Graphing and charting 
  • Task and time management 
  • Programming 

Some people get confused when in Microsoft Excel when it comes to the different formats available in Excel, so we have made this easier for you – Check out our article on the difference between Microsoft xls vs xlsx.

Many spreadsheet programs have emerged, but Microsoft Excel has prevailed unchallenged.  Some of its biggest advantages against the competition are: 

  1. Offline and online usage – Microsoft Excel initially was an offline program downloaded and installed on a computer. The only way to share it is to send files thru email. Now, with the Microsoft 365 innovation, Excel can be accessed and shared online thru different devices simultaneously. 
  1. Data capacity  – compared to Google Spreadsheets, which can process around 5,000,000 cells, Microsoft Excel can effortlessly organize 17,179,869,184 cells. That’s a huge difference in storage. Excel surpasses all spreadsheet competitors when it comes to capacity.  
  1. Formulas and illustrations – Excel remains superior as it offers a wide range of formulas and, in its years of experience, has been the leading program to provide robust visual presentations.  

Why choose Microsoft Excel?

What is this electronic spreadsheet most useful for?

With 14 categories and over 400 different functions, Microsoft Excel is the most widely used electronic spreadsheet software at home, in schools, and in almost all business establishments, big and small. Some of its features are: 

User friendly 

Learn the basics, and Microsoft Excel will work with you by understanding your habits and organizing your information. Use pre-made templates and recent formulas, and have a better gauge of your data thru interactive graphs and tables.  

Image recognition 

Eliminate errors in manually typing data from an analog table to an electronic spreadsheet. With the image recognition technology in the Excel app, you can take a photo of the printed chart using your iOs or Android device. It will be automatically transformed into a completely editable graph in Excel.  

Collaboration 

Work on your spreadsheet from the office, at home, and wherever possible. Microsoft Excel allows you to work together with your crew outside of the office by making it accessible thru your computer, your phone, or thru the website.  

Spiced-up spreadsheets 

Veer away from the boring, monotonous charts and diagrams, give your presentation a fresh look, and choose from the thousands of Excel template recommendations from the Microsoft website.  

Excel Advantages and Disadvantages  

Advantage 

  1. The simplest way to store data 
  • Even if you don’t know much about Excel formulas, its cells, rows, and columns make organizing simple data like daily sales and expenses easy. 
  1. Calculations made easy 
  • Learn about Excel’s basic functions like the sum or auto sum; you will never have to add all your entries manually. Automated calculations like this make our life a lot easier.  
  1. Complete tools for data analysis  
  • With its advanced tools and formulas, you won’t have to look elsewhere for your data analytics; Excel has got you covered.  
  1. Data visualization  
  • Make your reports understandable by converting your data into charts and graphs. 
  1. Free templates 
  • No time to create a presentation? No problem! Choose from Excel’s free templates and work your presentation like a pro.  
  1. Custom print 
  • Although most users utilize Excel to lessen their paperwork, if you need to print out your electronic spreadsheet, you can do so at a touch of a button. It also has provisions for customization like paper size, margin, and orientation.  
  1. Power Query and Power Pivot 
  • Power Query for data cleaning and transformation and Power Pivot for storing and calculating millions of data rows.  These two tools are part of the hundreds of Excel processes that make it unique.  

Disadvantage 

  1. It takes time to learn the syntax. 
  • Though basic functions like Sum, Average, and Vlookup are fairly easy to learn, most functions and formulas are advanced for the common user and require practice and patience to perfect.  
  1. Lack of security 
  • Since Excel can be shared thru multiple users on different devices, it is vulnerable and easy to hack, even with password protection. Important financial data should be stored elsewhere other than Excel.  
  1. Compatibility  
  • Microsoft Excel is created only for Windows and Mac operating systems. Users with Linux and other operating systems won’t be able to take advantage of it. Also, Excel 2007 and 2010’s system requirements are 500 MHz CPU and 256 RAM, meaning if you have an old computer, you must upgrade your system first.  
  1. Prone to human error 
  • Since data entries are typed manually, information is prone to typographical errors, which Excel won’t be able to filter or correct. It should be best practice to double-check your data before proceeding any further. 

Is Excel for everyone? 

Whether you are a budding business owner, an employee, a manager on a huge accounting firm, a student trying to manage your allowance wisely, or a mom of three who wants to keep a tab of your daily expenses, Excel has something for you.  

Managers and administrators 

Supervise data across your board efficiently and effectively without the need to approach them individually, especially if it’s a huge team we’re talking about. Even if you are starting out, Microsoft Excel lets you track and analyze your business data and send and collect information without complicated network systems. Make the most of your time and focus on the more significant things in growing your business.  

The smart-working employee 

Forget working hard and stressing about the unnecessary stuff, and start working smart by using Excel’s developed formulas on your reports. Stand out from the rest and make your presentations fun and comprehensive thru engaging dashboards, creative charts, and detailed interfaces. Conserve time and effort, and increase your productivity, whether working from home or at the office.  

Integration with existing platforms 

Microsoft 365, formerly known as SharePoint, brings collaboration to a whole new level as users can share, organize and update thru co-authoring capabilities wherever and whenever. All these functionalities and a lot of other possibilities are available not only for Excel but for all Microsoft Office platforms like Word and Powerpoint.  

TBB to your rescue 

Like most people, are you still intimidated by Excel and its functions? We at The Building Blocks are here to help! We create workflows tailored to fit your needs as a business or employee. Our outstanding automation process will smooth out and simplify your daily workload so you can regain control over your job and concentrate on the more fundamental parts of the business.