Get to know more about business intelligence. Utilize an interactive data analytics platform and transform the way you use data.
With The Business Blocks, you gain a competitive edge over companies similar to yours.
Smaller tasks are minimized, which maximizes your time to spend on the more important and challenging tasks at hand.
Additionally, the company promotes modernization by encouraging the movement to digitize your workplace.
The journey to a successful business isn’t a walk in the park. Aside from staying organized, you must analyze your competition and effectively keep track of data.
Fortunately, Tableau can cater to all these needs.
What Is Tableau?
According to the company itself, Tableau is a data analytics platform that transforms the way people use data to solve problems. The business analytics platform utilizes certain tools, such as:
DASHBOARD
Acting as a summary of all data collected, Tableau’s dashboards work to display all the necessary updates. Information is summarized in the form of texts, graphs, and other visual objects.
Personalized dashboards enable the user to prioritize needed information. Because of its easier access, you don’t have to waste time to find specific data reports.
DATA SHARING
Tableau users are allowed to share confidential data in a protected manner. Real-time data distribution enables employees to be briefed on significant events.
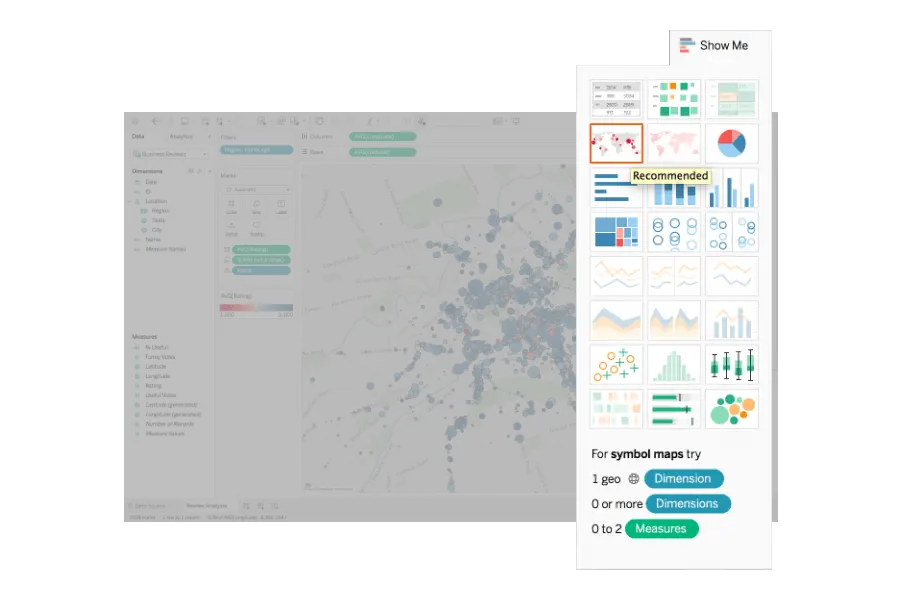
VISUALIZATIONS
Tableau has earned its remarkable reputation from its vast collection of interactive data visualization. Since the platform is pretty straightforward, users can create professional-looking visuals with minimal effort. Beginners won’t have problems designing their bar graph and pie chart.
Advanced users have the option of using more complicated visuals like histogram, treemap, Gantt chart, boxplot, bullet chart, and motion chart.
Other users turn to Tableau to construct impressive maps. The platform comes with the information needed for maps, such as zip codes, cities, and boundaries.
Maps can be as detailed as you want them to be, as you can even add geographical layers. Available map templates include choropleth maps, point distribution maps, heat maps, and flow maps.
What Does Tableau Do?
Tableau is an interactive data visualization tool that can simply make raw data comprehensible. It is recognized for:
Handling Data
The platform allows the data to be aesthetically and purposefully interpreted. Users can customize visuals through colors and dimensions of their choice, making their business insights much more impressive.
Visualizations of data are an important part of a business because businesses generate so much data. The more data sources are discovered, the more business managers and employees appreciate data tools like Tableau.
Beginner Friendly
The application bears a reputation for making comprehensive and interactive data, even to amateurs. This prevents any chance of misinterpretations or further explanations that could negatively affect crucial decisions regarding the company.
Live Analysis
To improve your business, you should effectively analyze data. Through interactive data analysis, you are capable of researching products, marketing, and customers.
Tools, such as Tableau, lets you identify who your business appeals to the most. Distinguishing your target audience provides more room for potential clients and recognition.
Collaboration
As the famous line says, “Two heads are better than one”. The same thing applies to business analytics. Companies that have collaborative teams are more likely to thrive through their team’s knowledge, experience, and skills.
Tableau enforces collaboration with each employee involved, eliminating the chances of overlooked data. As the company receives answers to their questions, employees can also create and reinforce bonds while working as a team.
Why Should You Use Tableau?
How can it help your business as a data analytics platform?
Why do big companies like LinkedIn and Cisco Systems use Tableau? The simple answer is that it has so much to offer businesses that are both big and small, such as:
- Saves Time
Time management is crucial to businesses because they must perform as many tasks as possible to reach goals. Tableau acts as an assistant in performing small and pesky tasks so you can focus on the more important things.
- Preparation
You can technically predict the future through data analysis tools. Tableau keeps track of patterns based on past data to create detailed predictions. Data forecasts give the company a heads up and assure preparation for unexpected situations.
- Decision Making
Since the data is extracted from direct sources, all the information displayed is based on facts. Knowing that every decision can seriously impact a business, it can be a difficult process. Tableau understands this and conveniently provides updated reports that you can base your decisions on.
- Safety
Data contains your business’ confidential records. To ensure that it doesn’t fall into the wrong hands, Tableau developed a trustworthy security system. Information is secured by permission requests and authentication processes.
Tableau genuinely cares that their customers are satisfied with their security to the point that their security team will thoroughly investigate reported vulnerabilities. Additionally, they will work to ensure your data is secured. Only the necessary employees will handle your data as a sign of respect for your privacy.
- Ask Data
Search engines make life easier and Tableau has incorporated one in their application. By simply typing keywords in the search bar, Tableau will show the most relevant results. Some results may show up as text, while others may show up as visuals.
CrazyEgg put together a great article to help you navigate the business intelligence software space – Check out the article here.
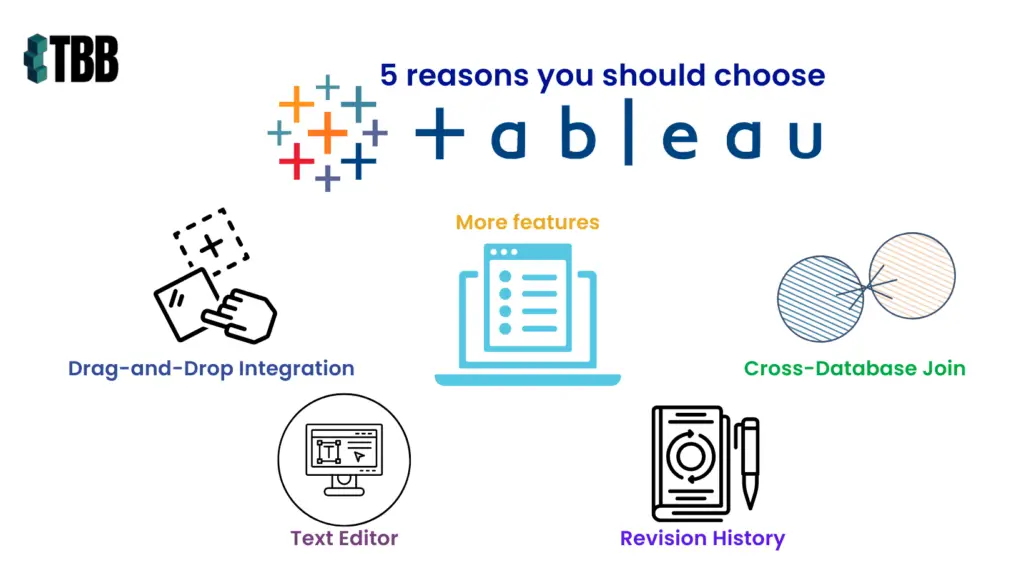
Tableau has many more features…
Other features that Tableau can offer can be identified as:
Cross-Database Join: a functionality that creates a “bridge” between data sources. It makes data blending easier since you won’t have to keep entering asterisks.
Drag-and-Drop Integration: gives the user better control of how the visual is formatted so that they can achieve the graphic design they desire.
Text Editor: provides the user freedom to change the font, font size, and font color to their taste.
Revision History: allows the user to view logs of when and who created changes. If you prefer an older version of the file, the Revision History can help with restoration.
Target Market
Tableau works perfectly for managers who have too much on their plates. Dealing with the endless cycle of data generation and organizing it is harder than it sounds.
When you include managing your team and meeting company goals, it can be pretty overwhelming. Tableau decreases minimal tasks, so you can manage your time wisely.
On the other hand, employees can also benefit from Tableau. All the data is stored in one place, which makes it accessible when you need it for reference. Well-constructed visuals give presentations and reports that allow you to impress your colleagues.
The platform is easy to use which benefits beginners. Advanced users will be comfortable with the platform since they will be able to showcase their graphic design skills.
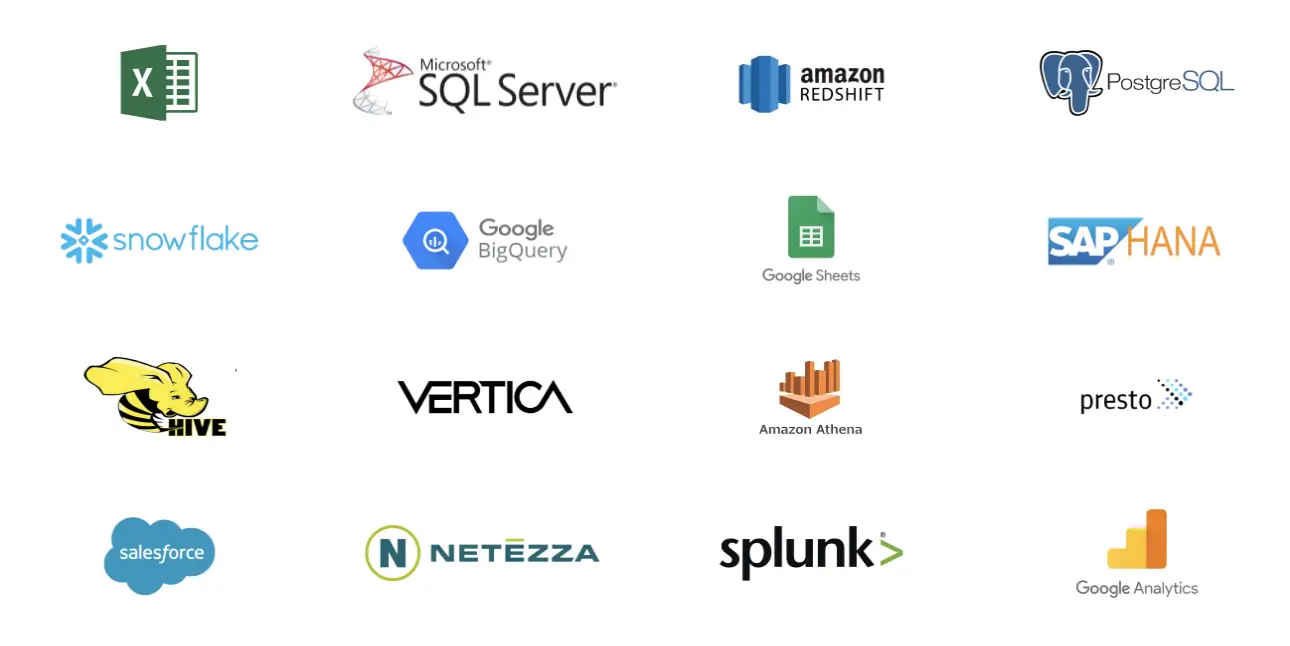
Integrations with Other Platforms
This business intelligence platform works well with other programs, such as:
- Actian
- Alibaba
- Amazon
- Anaplan
- Apache Drill
- Aster Database
- Azure
- Box
- Cloudera Hadoop
- Databricks
- Datorama by Salesforce
- Denodo
- Dremio by Dremio
- Dropbox
- Esri ArcGIS Server
- Exasol
- Firebird 3
- Hortonworks Hadoop Hive
- IBM
- Impala
- Intuit QuickBooks Online
- JSON File
- Kognitio
- Kyvos
- LinkedIn Sales Navigator
- MariaDB
- MarkLogic
- Marketo
- MapR Hadoop Hive
- Microsoft
- MonetDB
- MongoDB BI Connector
- MySQL
- OData
- OneDrive
- Oracle
- PDF File
- Pivotal Greenplum
- PostgreSQL
- Presto
- Progress OpenEdge
- Qubole Presto
- SAP
- Salesforce
- ServiceNow ITSM
- SharePoint
- SingleStore
- Snowflake
- Spark SQL
- Spatial File
- Splunk
- Statistical File
- TIBCO Data Virtualization (Cisco Information Server)
- Tableau Server or Tableau Online
- Teradata
- Vertica
Conclusion
Although Tableau may be a simple business intelligence software, it has plenty to offer.
Its wide range of functions includes turning data into visuals, syncing data from several resources, and possessing the ability to create forecasts based on past data entries.
Tableau is one of the only platforms that prioritizes and ensures data protection. Reported problems will be handled within a day by their security team.
Many big brands like Wells Fargo, Coca Cola, and Nike associate themselves with Tableau for this reason.
Interactive data visualization tools can bring a new approach in solving problems to the table. Visuals help to quickly detect problems and solve them as efficiently as possible.
Lastly, Tableau lets you manage your time wisely. When using the software, you can focus on more important duties rather than having to deal with actual data.
Unlike the average human, Tableau can keep up with the ongoing generation of data. Employees are more capable of staying on top of their workload with Tableau as their assistant.

If you feel like Tableau is a good fit for you, you can reach out to The Building Blocks for further assistance. They serve to provide your business with tools that are cost-effective like Tableau.